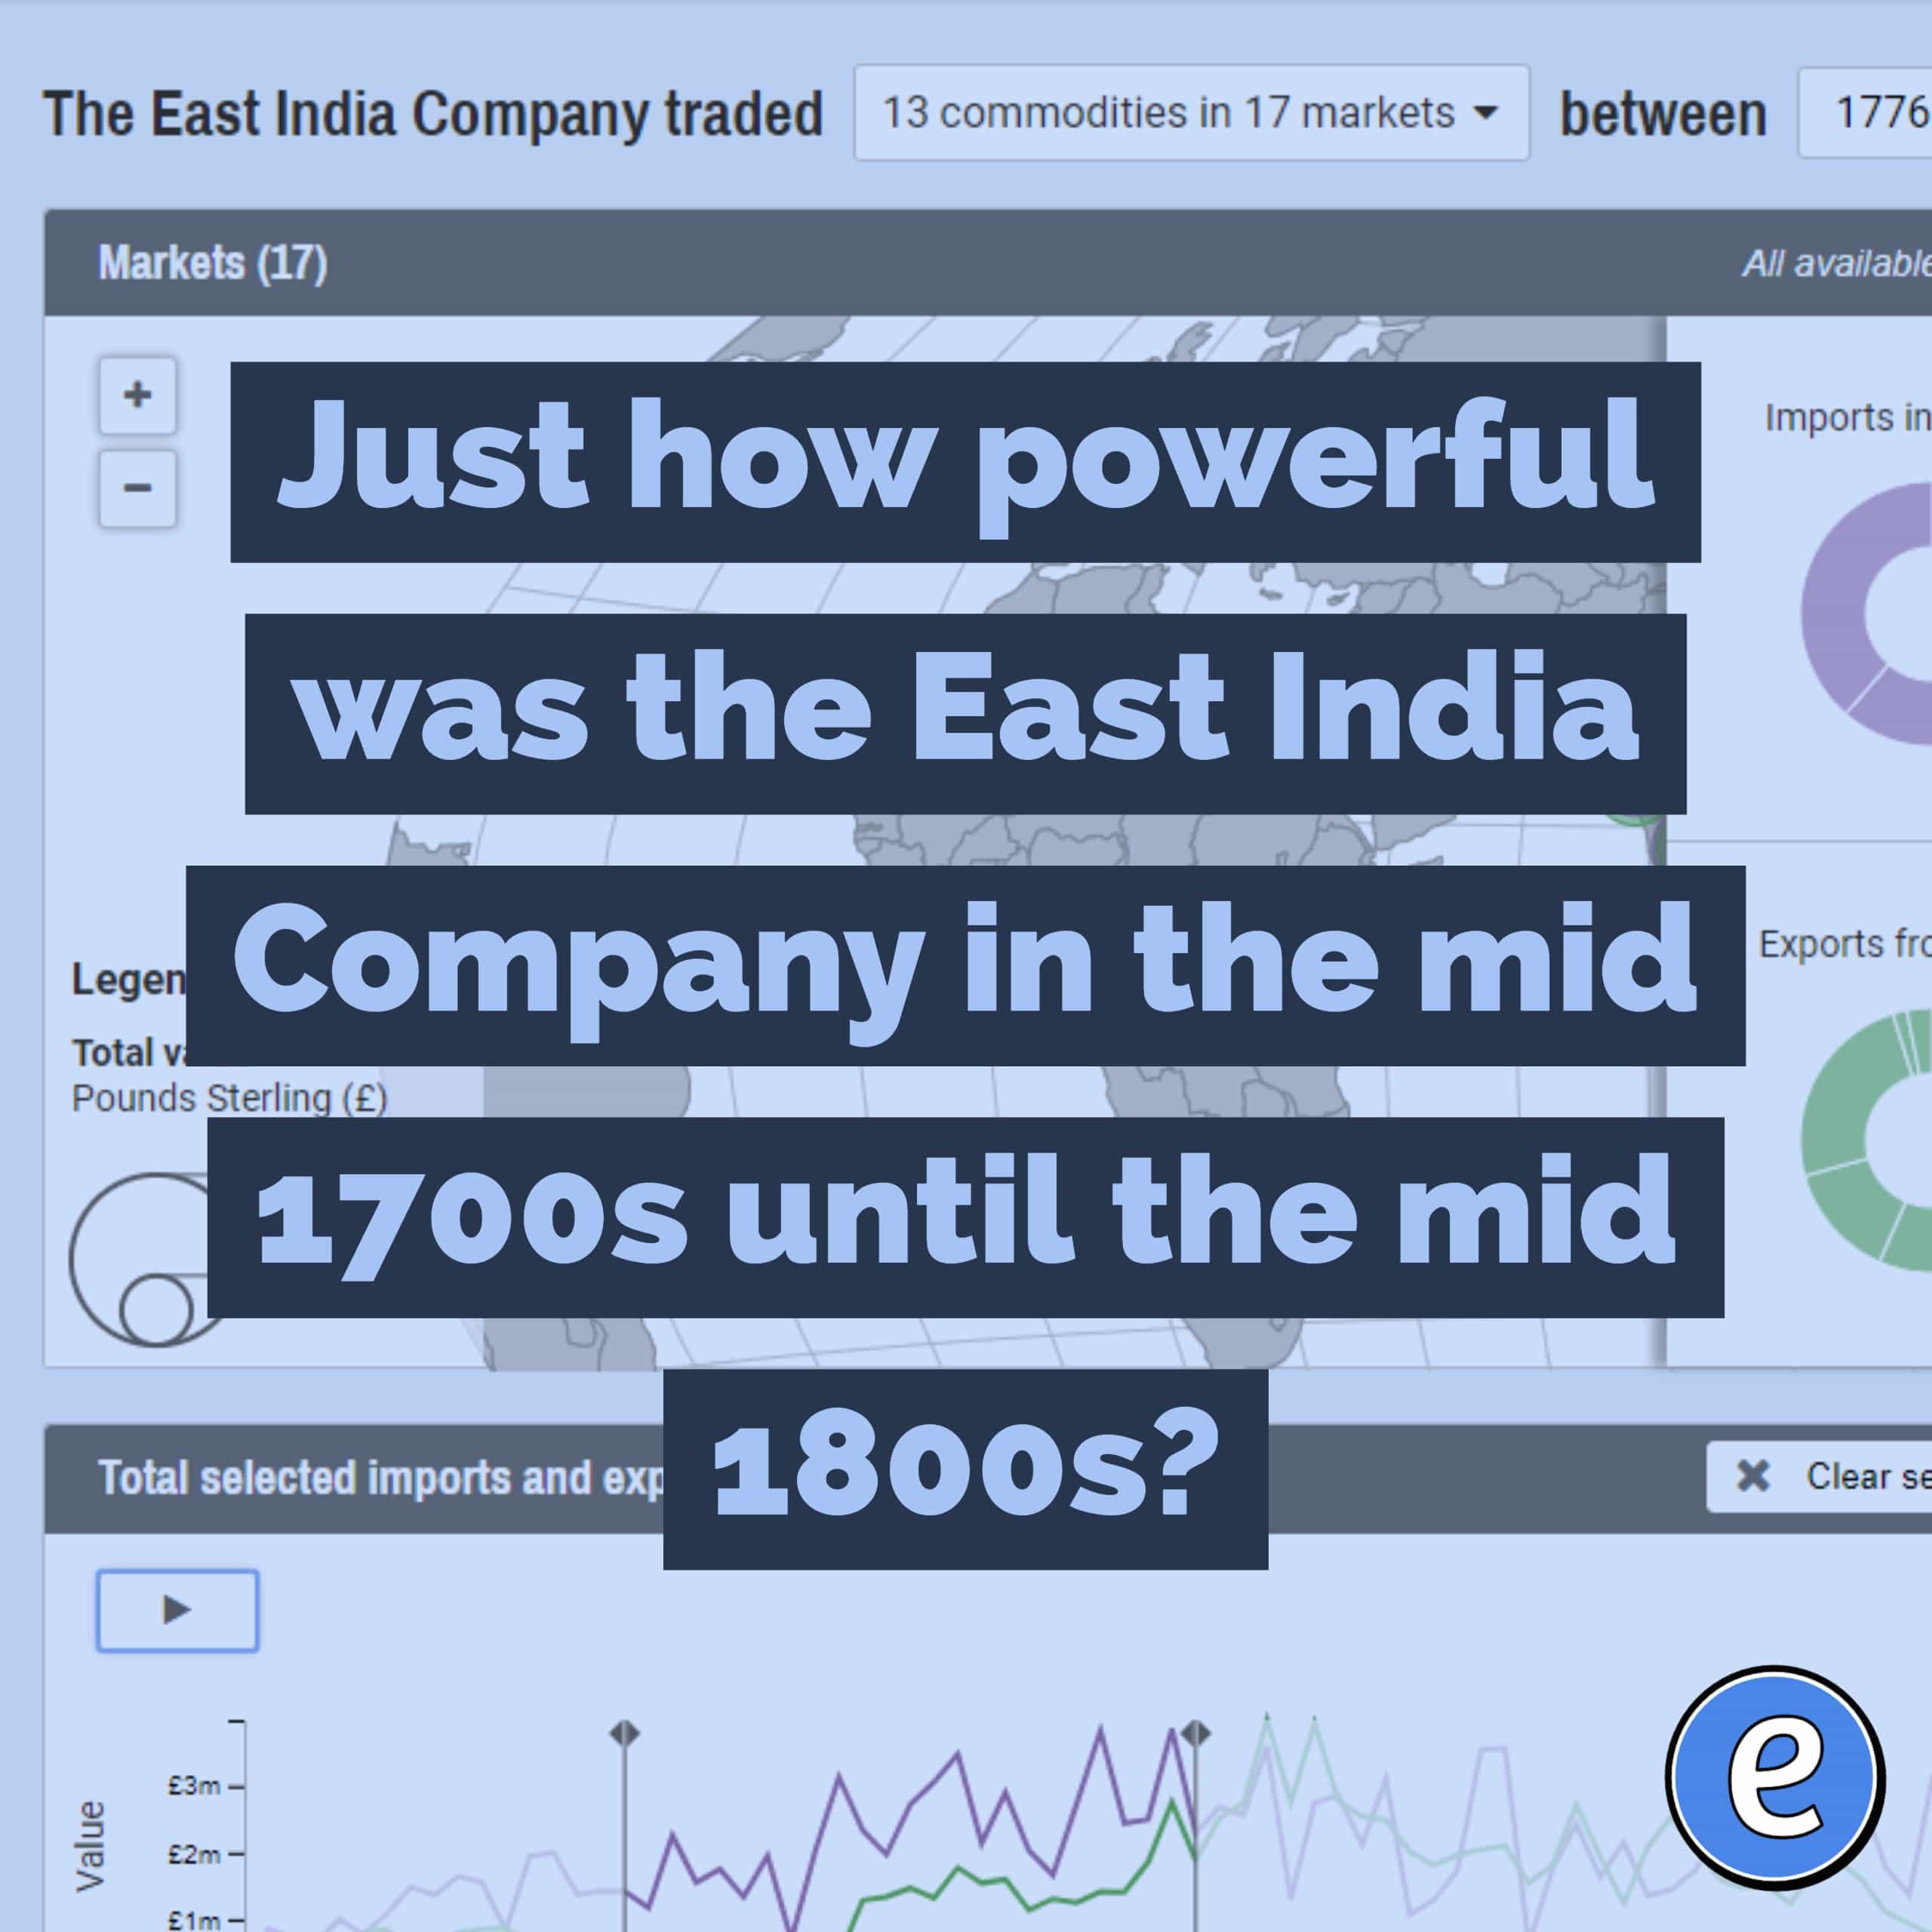
Just how powerful was the East India Company in the mid 1700s until the mid 1800s?
This feature is an interactive visualisation of the East India Company’s trade between 1760 and 1834. Use the map, line graph and sparklines to select markets, commodities and date ranges to explore.
Source: East India Company
A powerful visualization and animation of the dominance of the world’s most powerful company from 1760 to 1834.