The Surprising History of the Infographic | History | Smithsonian
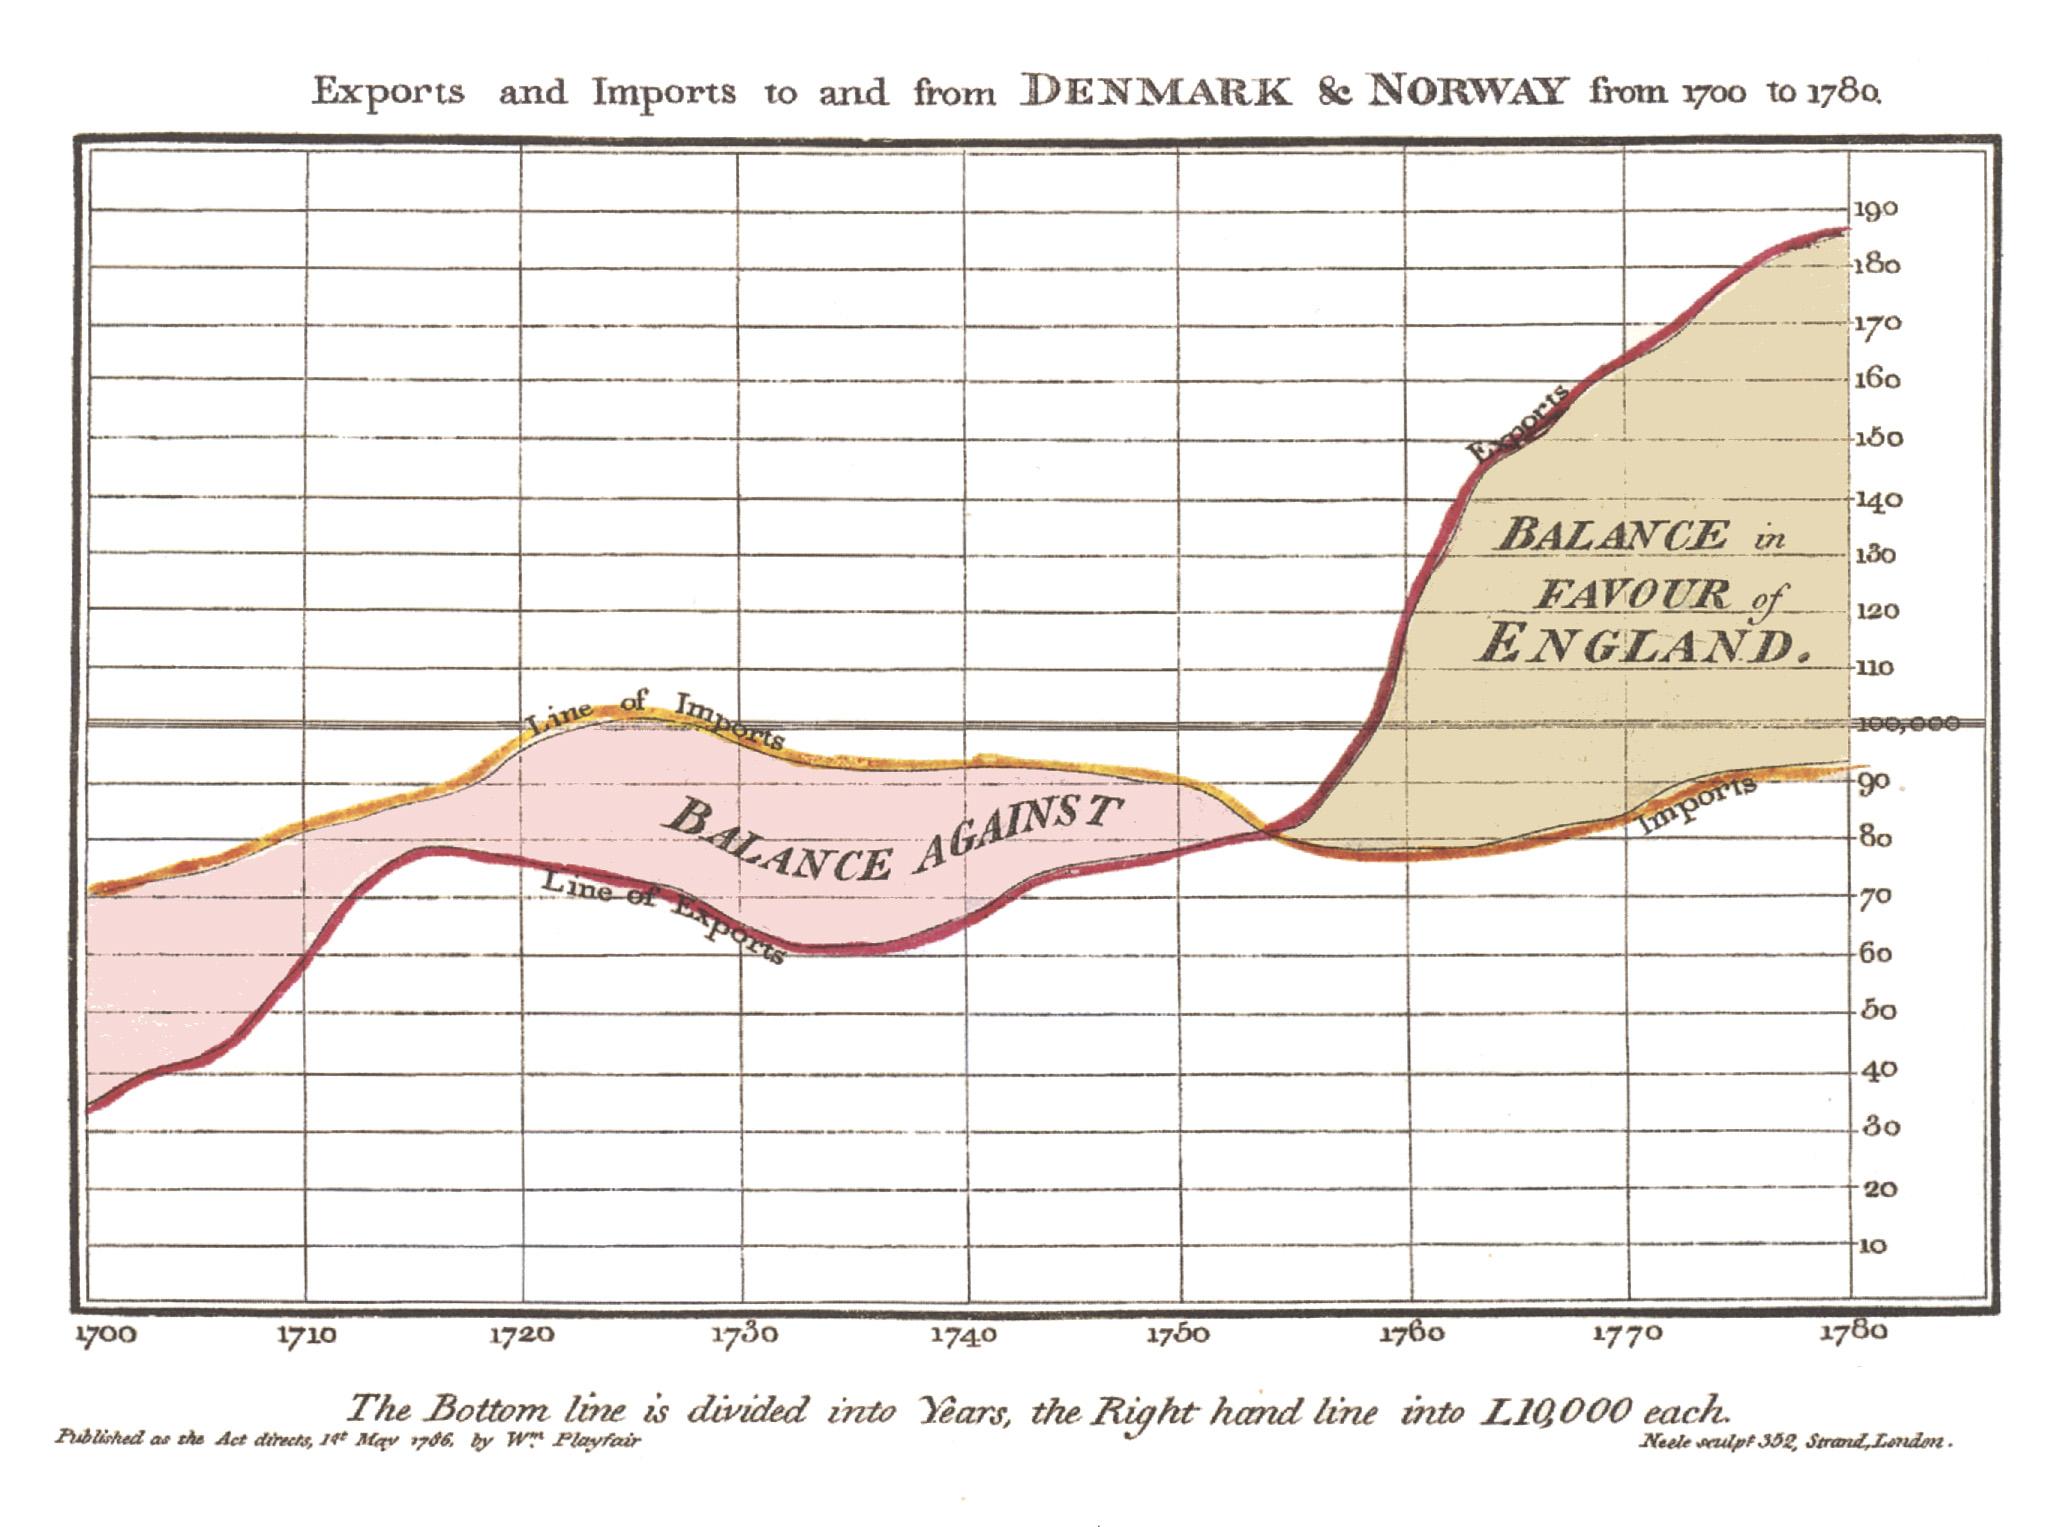
We live in an age of data visualization. Go to any news website and you’ll see graphics charting support for the presidential candidates; open your iPhone and the Health app will generate personalized graphs showing how active you’ve been this week, month or year. Sites publish charts showing how the climate is changing, how schools are…
