Quickly create pie charts, histograms, and line graphs online
Use Pie Chart Maker to create a Pie Chart for free with easy to use tools and download the Pie Chart as jpg or png or svg file. The same company also has Histogram Maker and Line Graph Maker. The three tools work very much the same so I’m going to just demonstrate Pie Chart Maker in this article.
Let’s create some pie charts
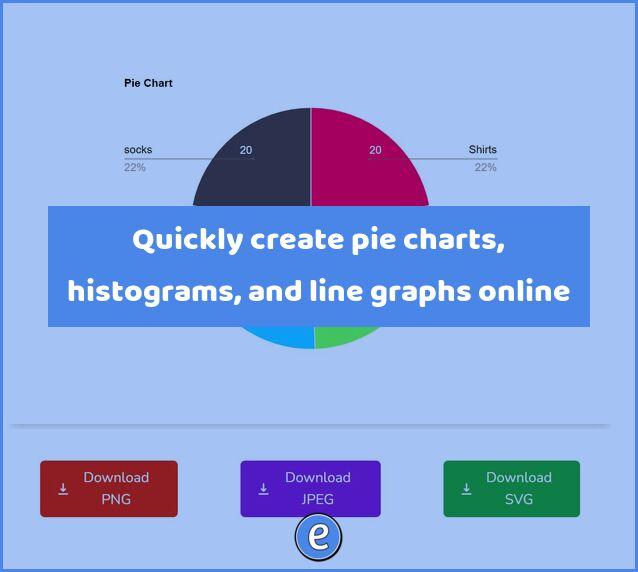
Pie Chart Maker is one of the easiest ways I’ve found to quickly create a Pie Chart. You fill out the form with your data and how you want the pie chart to look:

Once you are done, you click Generate Graph. At the bottom of the page you will see your lovely pie chart along with three buttons which you can use to download your chart in various formats. Unfortunately the PNG version doesn’t have a transparent background, which is a bummer.
Extras
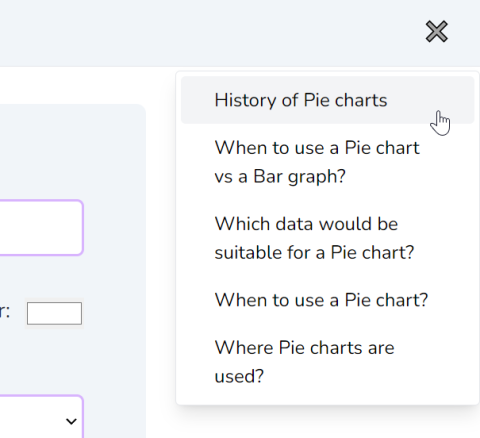
On the pie chart site you can click the three line menu in the upper right to learn more about pie charts. This would be nice to show students so they can get used to figuring out when and when not to use a pie chart.
The line graph site has navigational buttons at the top of the page to let you create bar graphs, a doughnut chart, scatter chart, and radar chart.
In practice
These sites aren’t going to replace what you can create in Google Sheets or Excel, but sometimes you don’t need all of the bells and whistles in those packages. In those cases, these sites are pretty nice to have in your arsenal.