Similar Posts

VideoNot.es: The easiest way to take notes synchronized with videos!
The easiest way to take notes synchronized with videos! Source: VideoNot.es: The easiest way to take notes synchronized with videos! VideoNot.es loads a video on the left side, and lets the user take notes about the video on the right. The notes are linked to the specific time of the video. The notes themselves are…
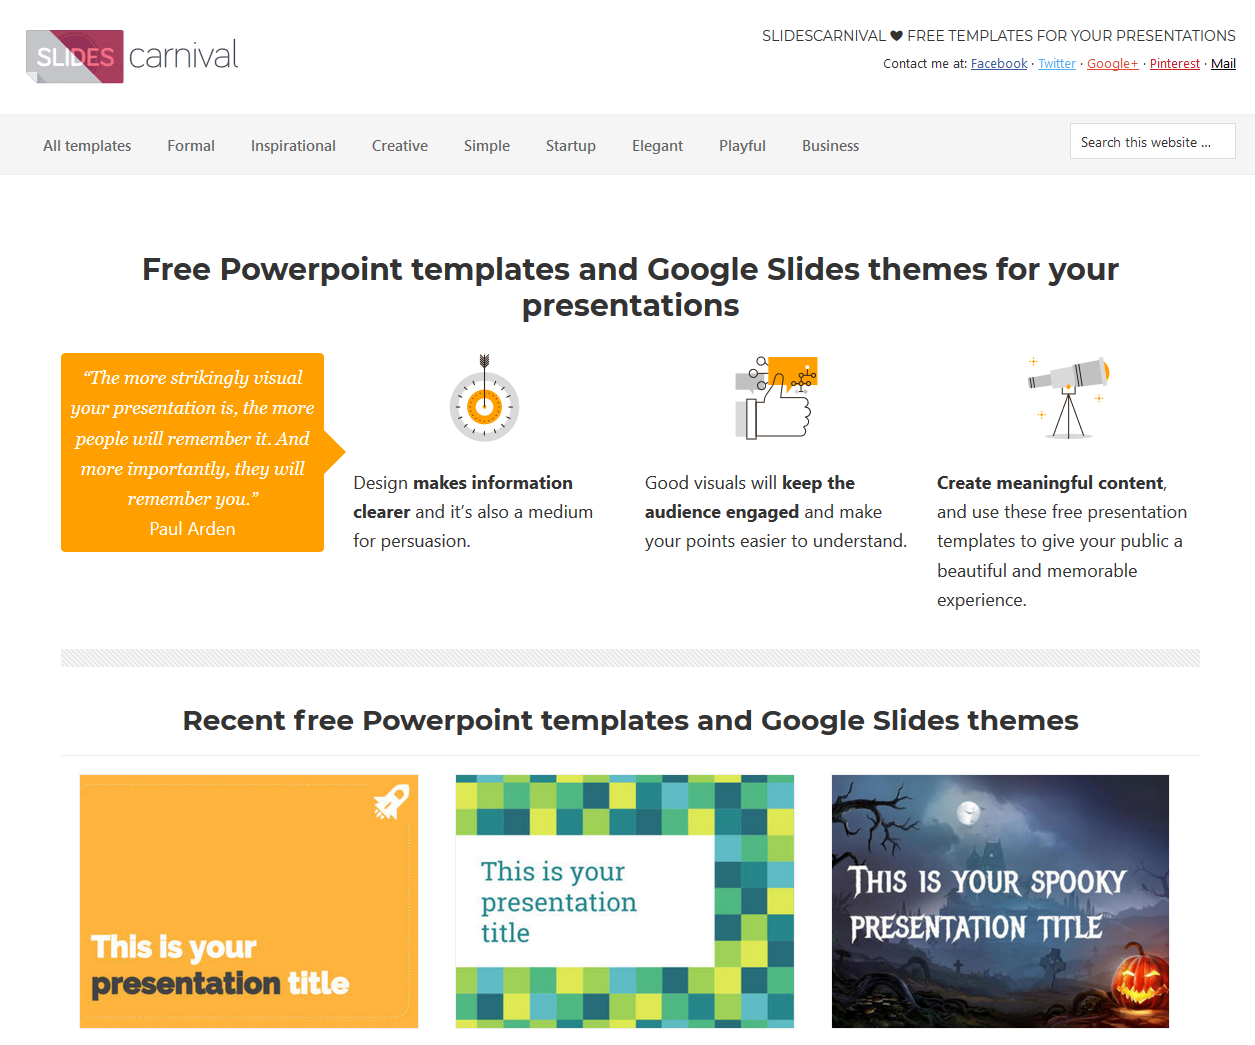
Free Google Slides and PowerPoint templates from Slides Carnival
Source: SlidesCarnival – Free Powerpoint templates and Google Slides themes for presentations Are you tired of the default themes in Google Slides? Then check out the free templates from SlidesCarnival! To use one of the templates, scroll to the bottom of the template page. There are two buttons, one to download the Powerpoint template, the…
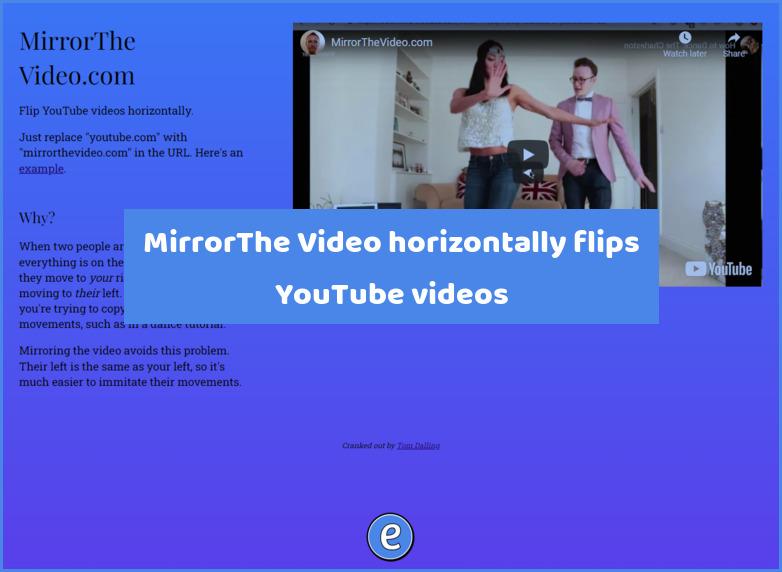
MirrorThe Video horizontally flips YouTube videos
Source: Mirror the Video.com We’ve all been there, trying to learn the latest dance for our Tik Tok videos. Ok, maybe we haven’t been there, but we want to bust-a-move at the next wedding we are at and we’ve found the perfect dance on YouTube. However, the video we are watching is just of the…
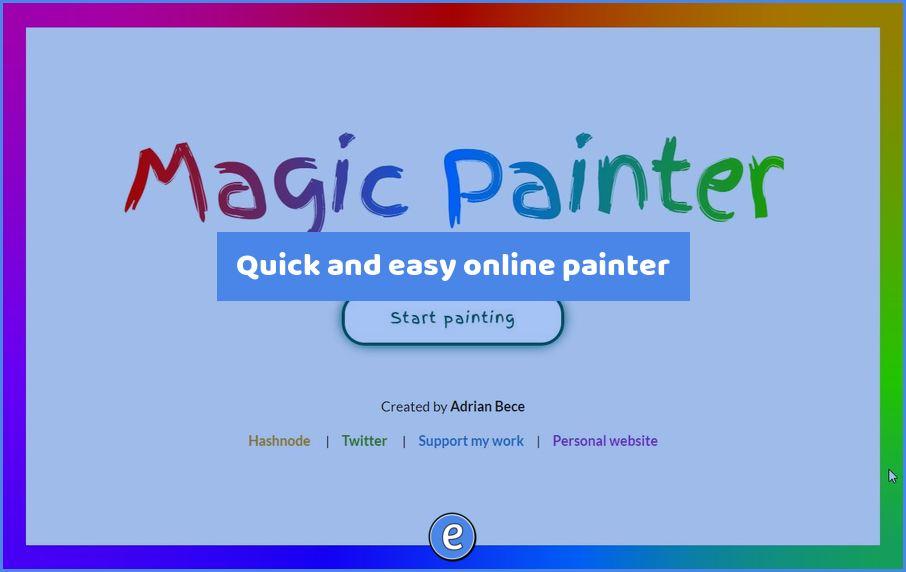
Quick and easy online painter
Source: Magic Painter | By Adrian Bece Magic Painter is for when you need the world’s easiest drawing app. There is no undo, no layers, and no shapes. It sounds pretty limited, but limitation breeds creativity. The site requires no registration, and you cannot save your work in progress. When you are finished with your…
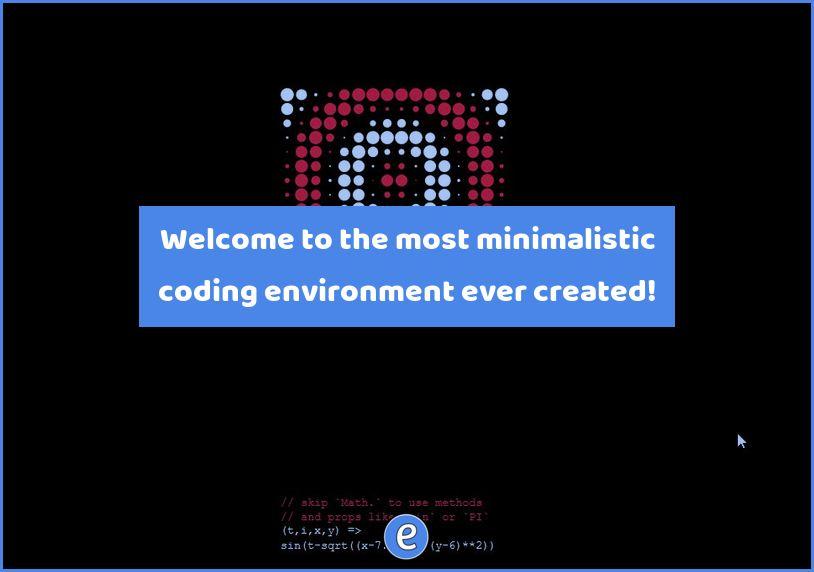
Welcome to the most minimalistic coding environment ever created!
Source: tixy.land It took me awhile to wrap my head around tixy.land, but the author’s Twitter announcement thread helps. Basically, you have one line of up to 32 characters at the bottom of the screen where you write your code. The math of the examples is above my head, but maybe some math teachers can…

Amazon Rapids is a subscription service that offers short stories for kids aged 7-12
Amazon Rapids offers a playful approach to children’s reading, with illustrated and original short stories written in a unique chat style that brings stories to life, one message at a time. Source: Amazon Rapids Amazon Rapids is a subscription service that offers short stories for kids aged 7-12. The interesting aspect of this program is the format…
