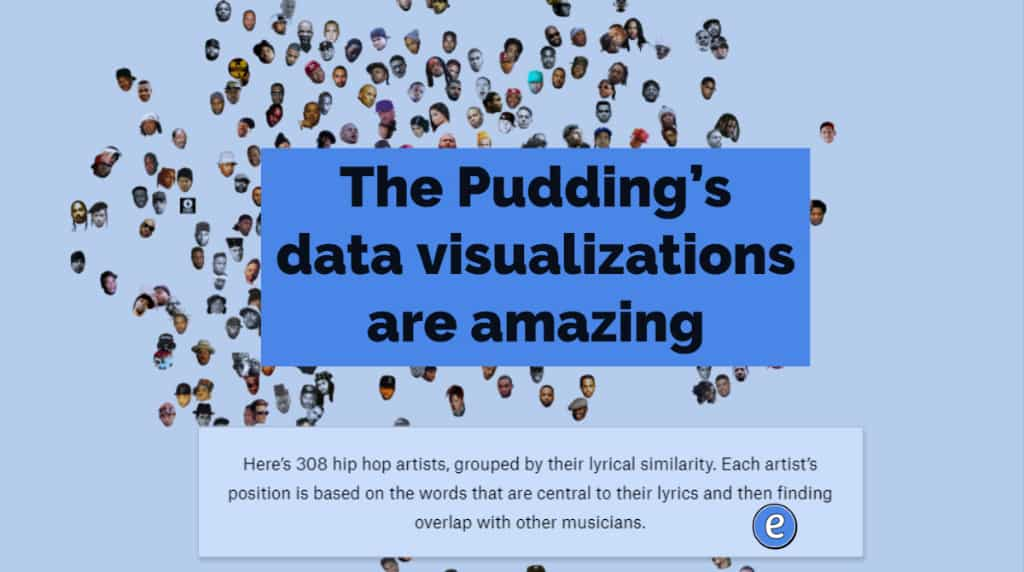
The Pudding’s data visualizations are amazing
The Pudding’s data visualizations are amazing. Source: The Pudding Oh my goodness, the Pudding’s visualizations and research are amazing. I could spend all day reading through their data and seeing the data visualized. If The Pudding has covered a topic you are covering in class, their visualizations and information would be well worth sharing!