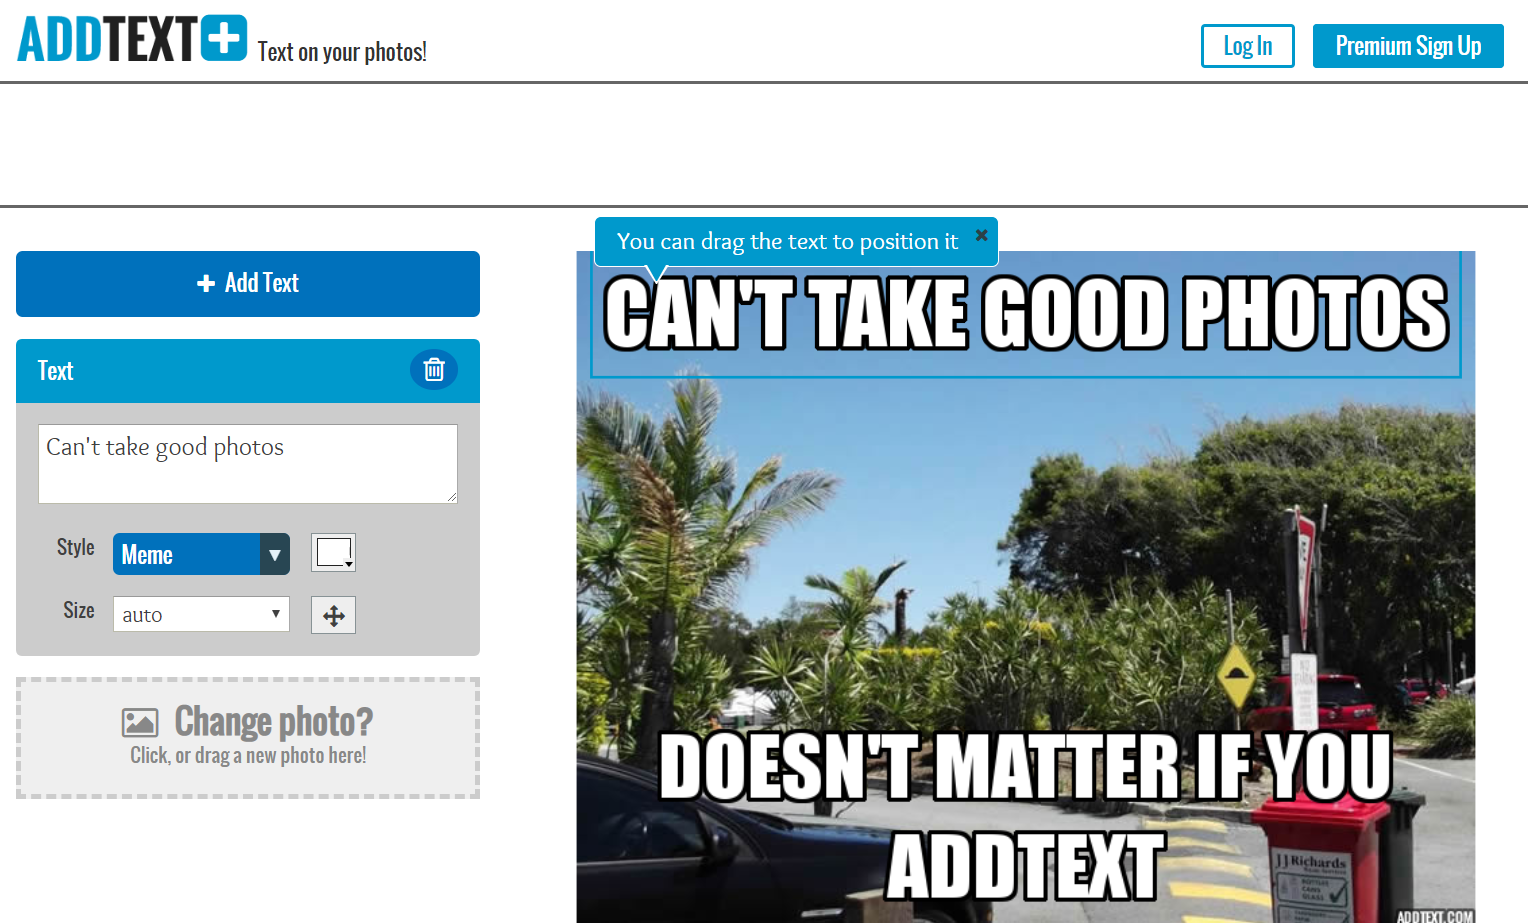
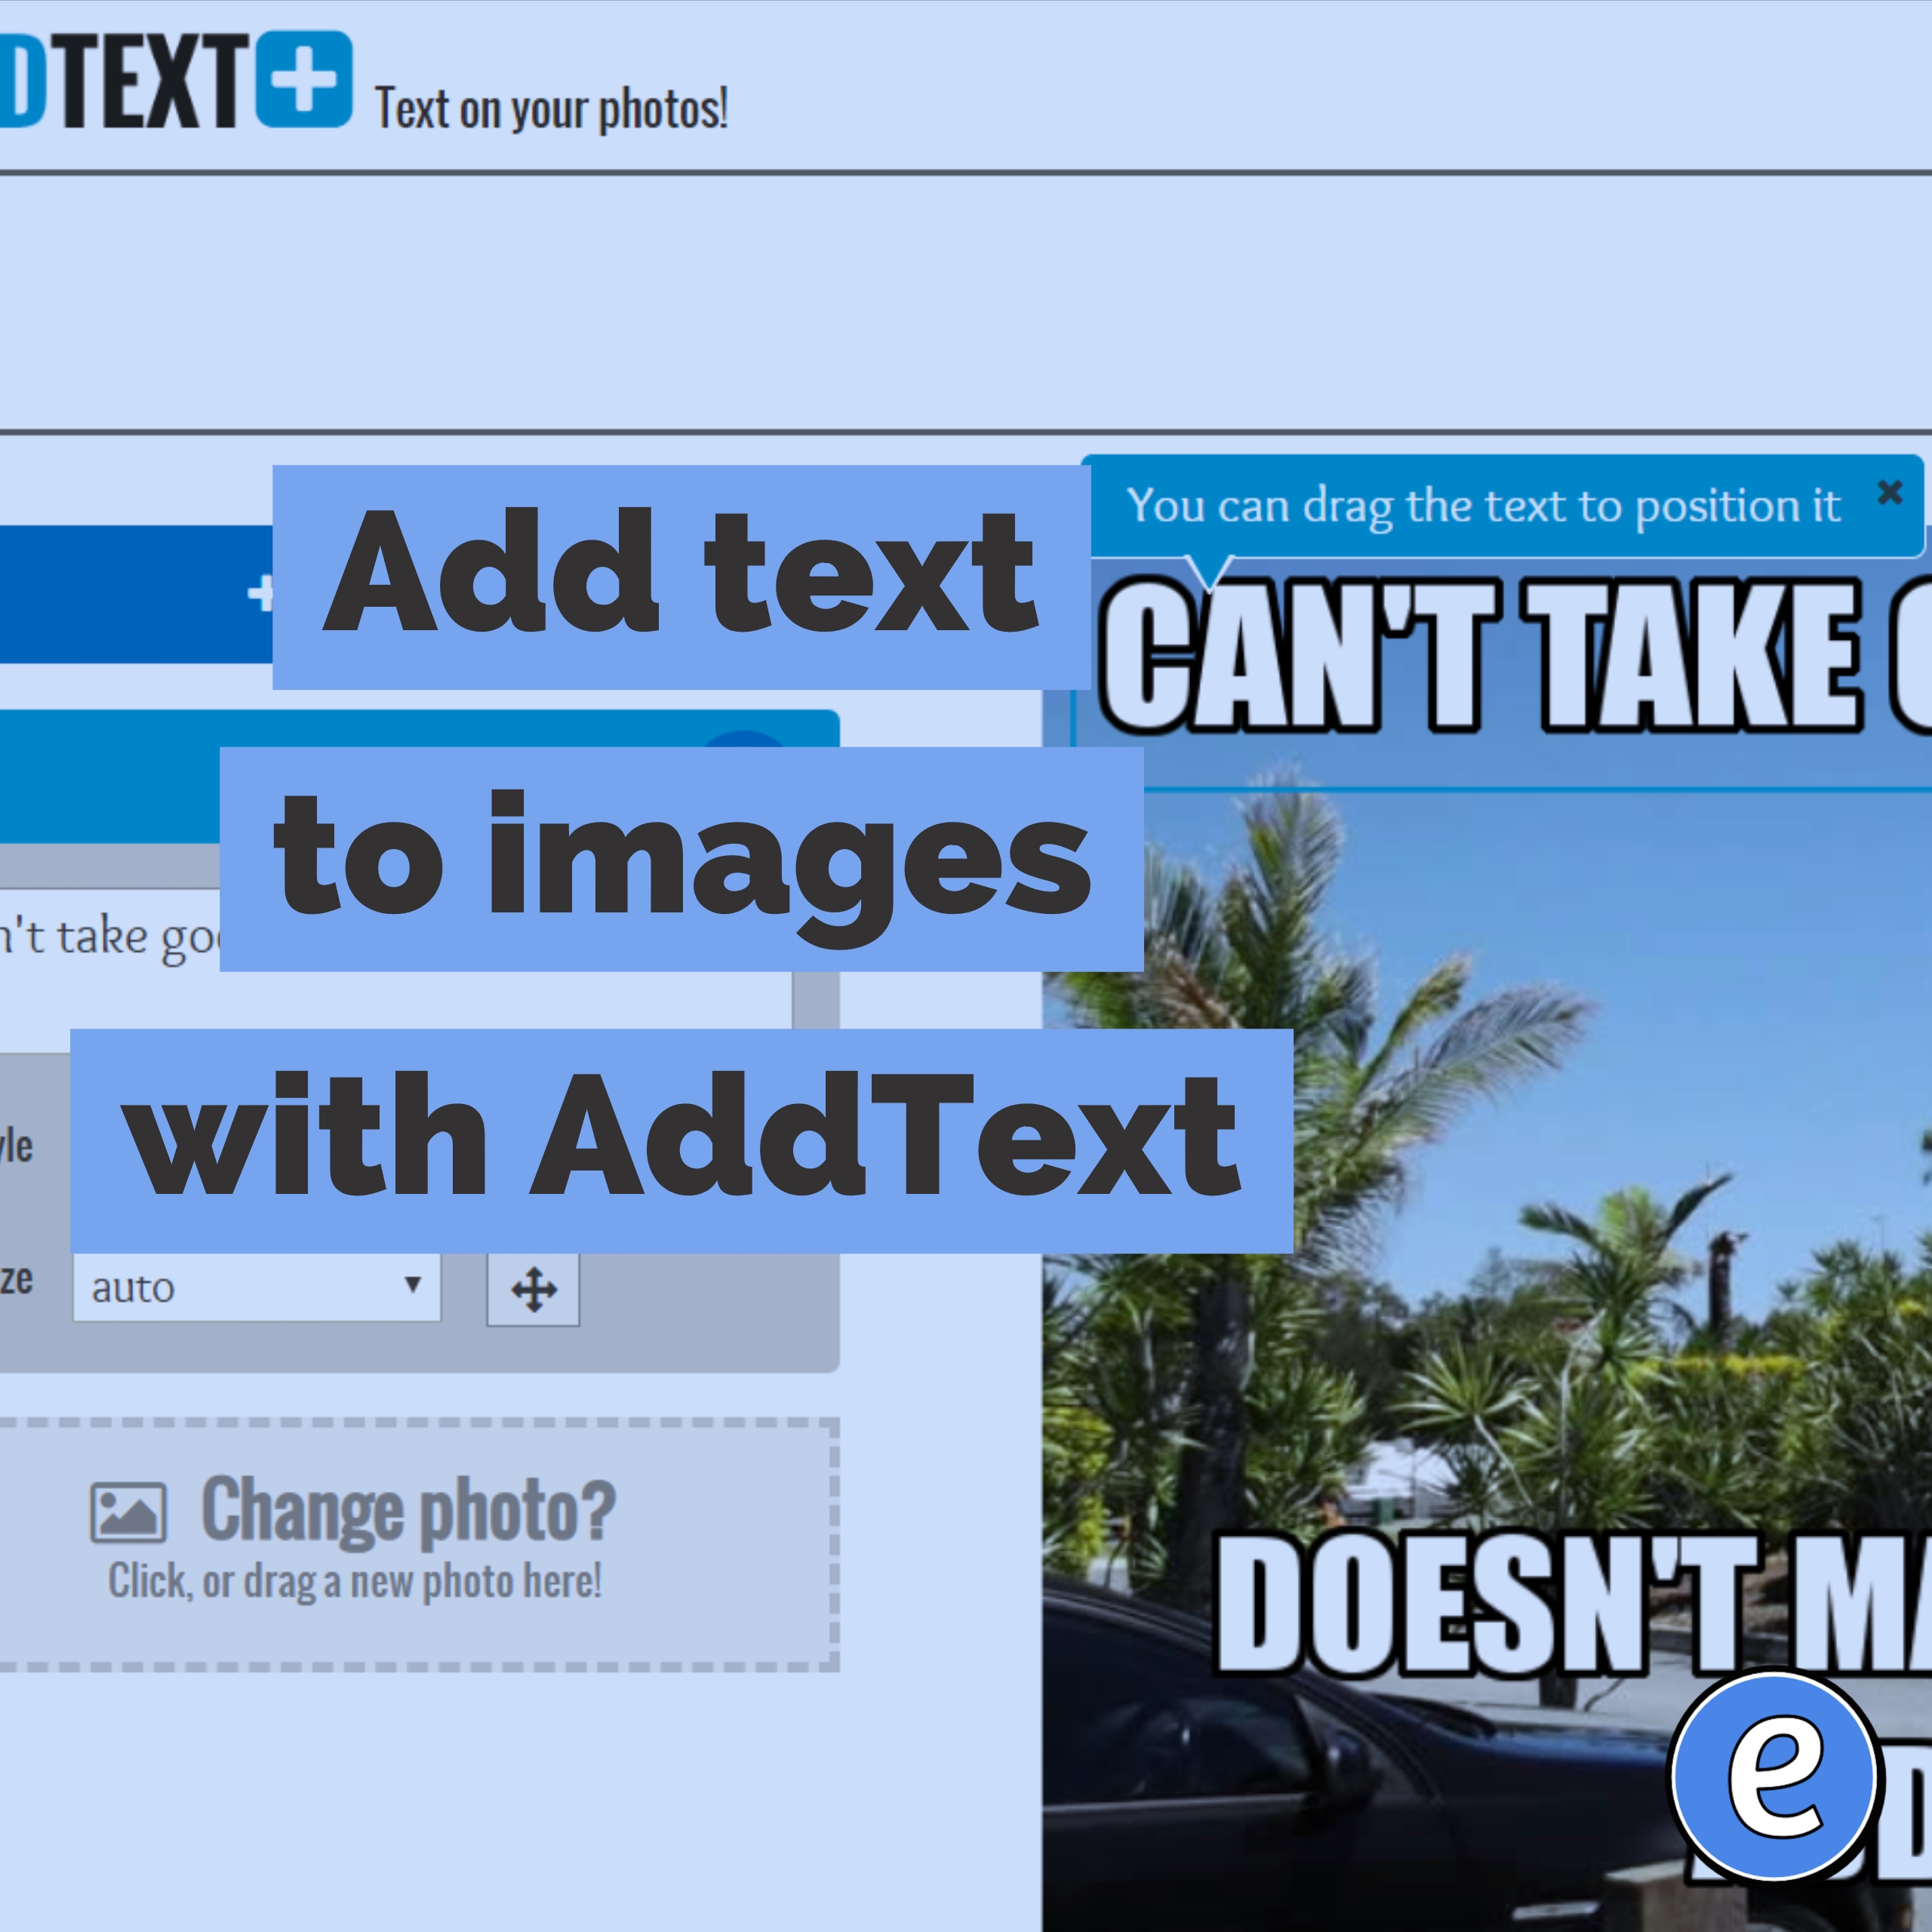
Add text to images with AddText
Source: AddText — Captions for your photos, quick and easy
AddText is a great tool to quickly add text to any image, and it doesn’t require an account!
Source: AddText — Captions for your photos, quick and easy
AddText is a great tool to quickly add text to any image, and it doesn’t require an account!
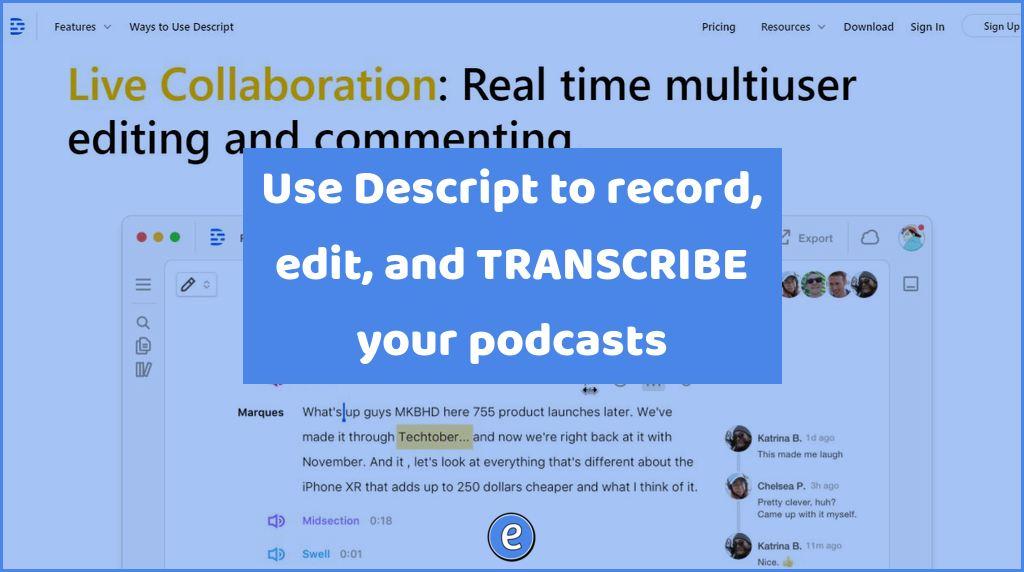
Source: Descript | Create podcasts, videos, and transcripts Descript is the rare piece of software that not only does amazing things, but it is also reasonably priced. If you ever wanted an easy way to edit your podcast, take a look at Descript. To start with Descript, you need to feed it some audio. The…
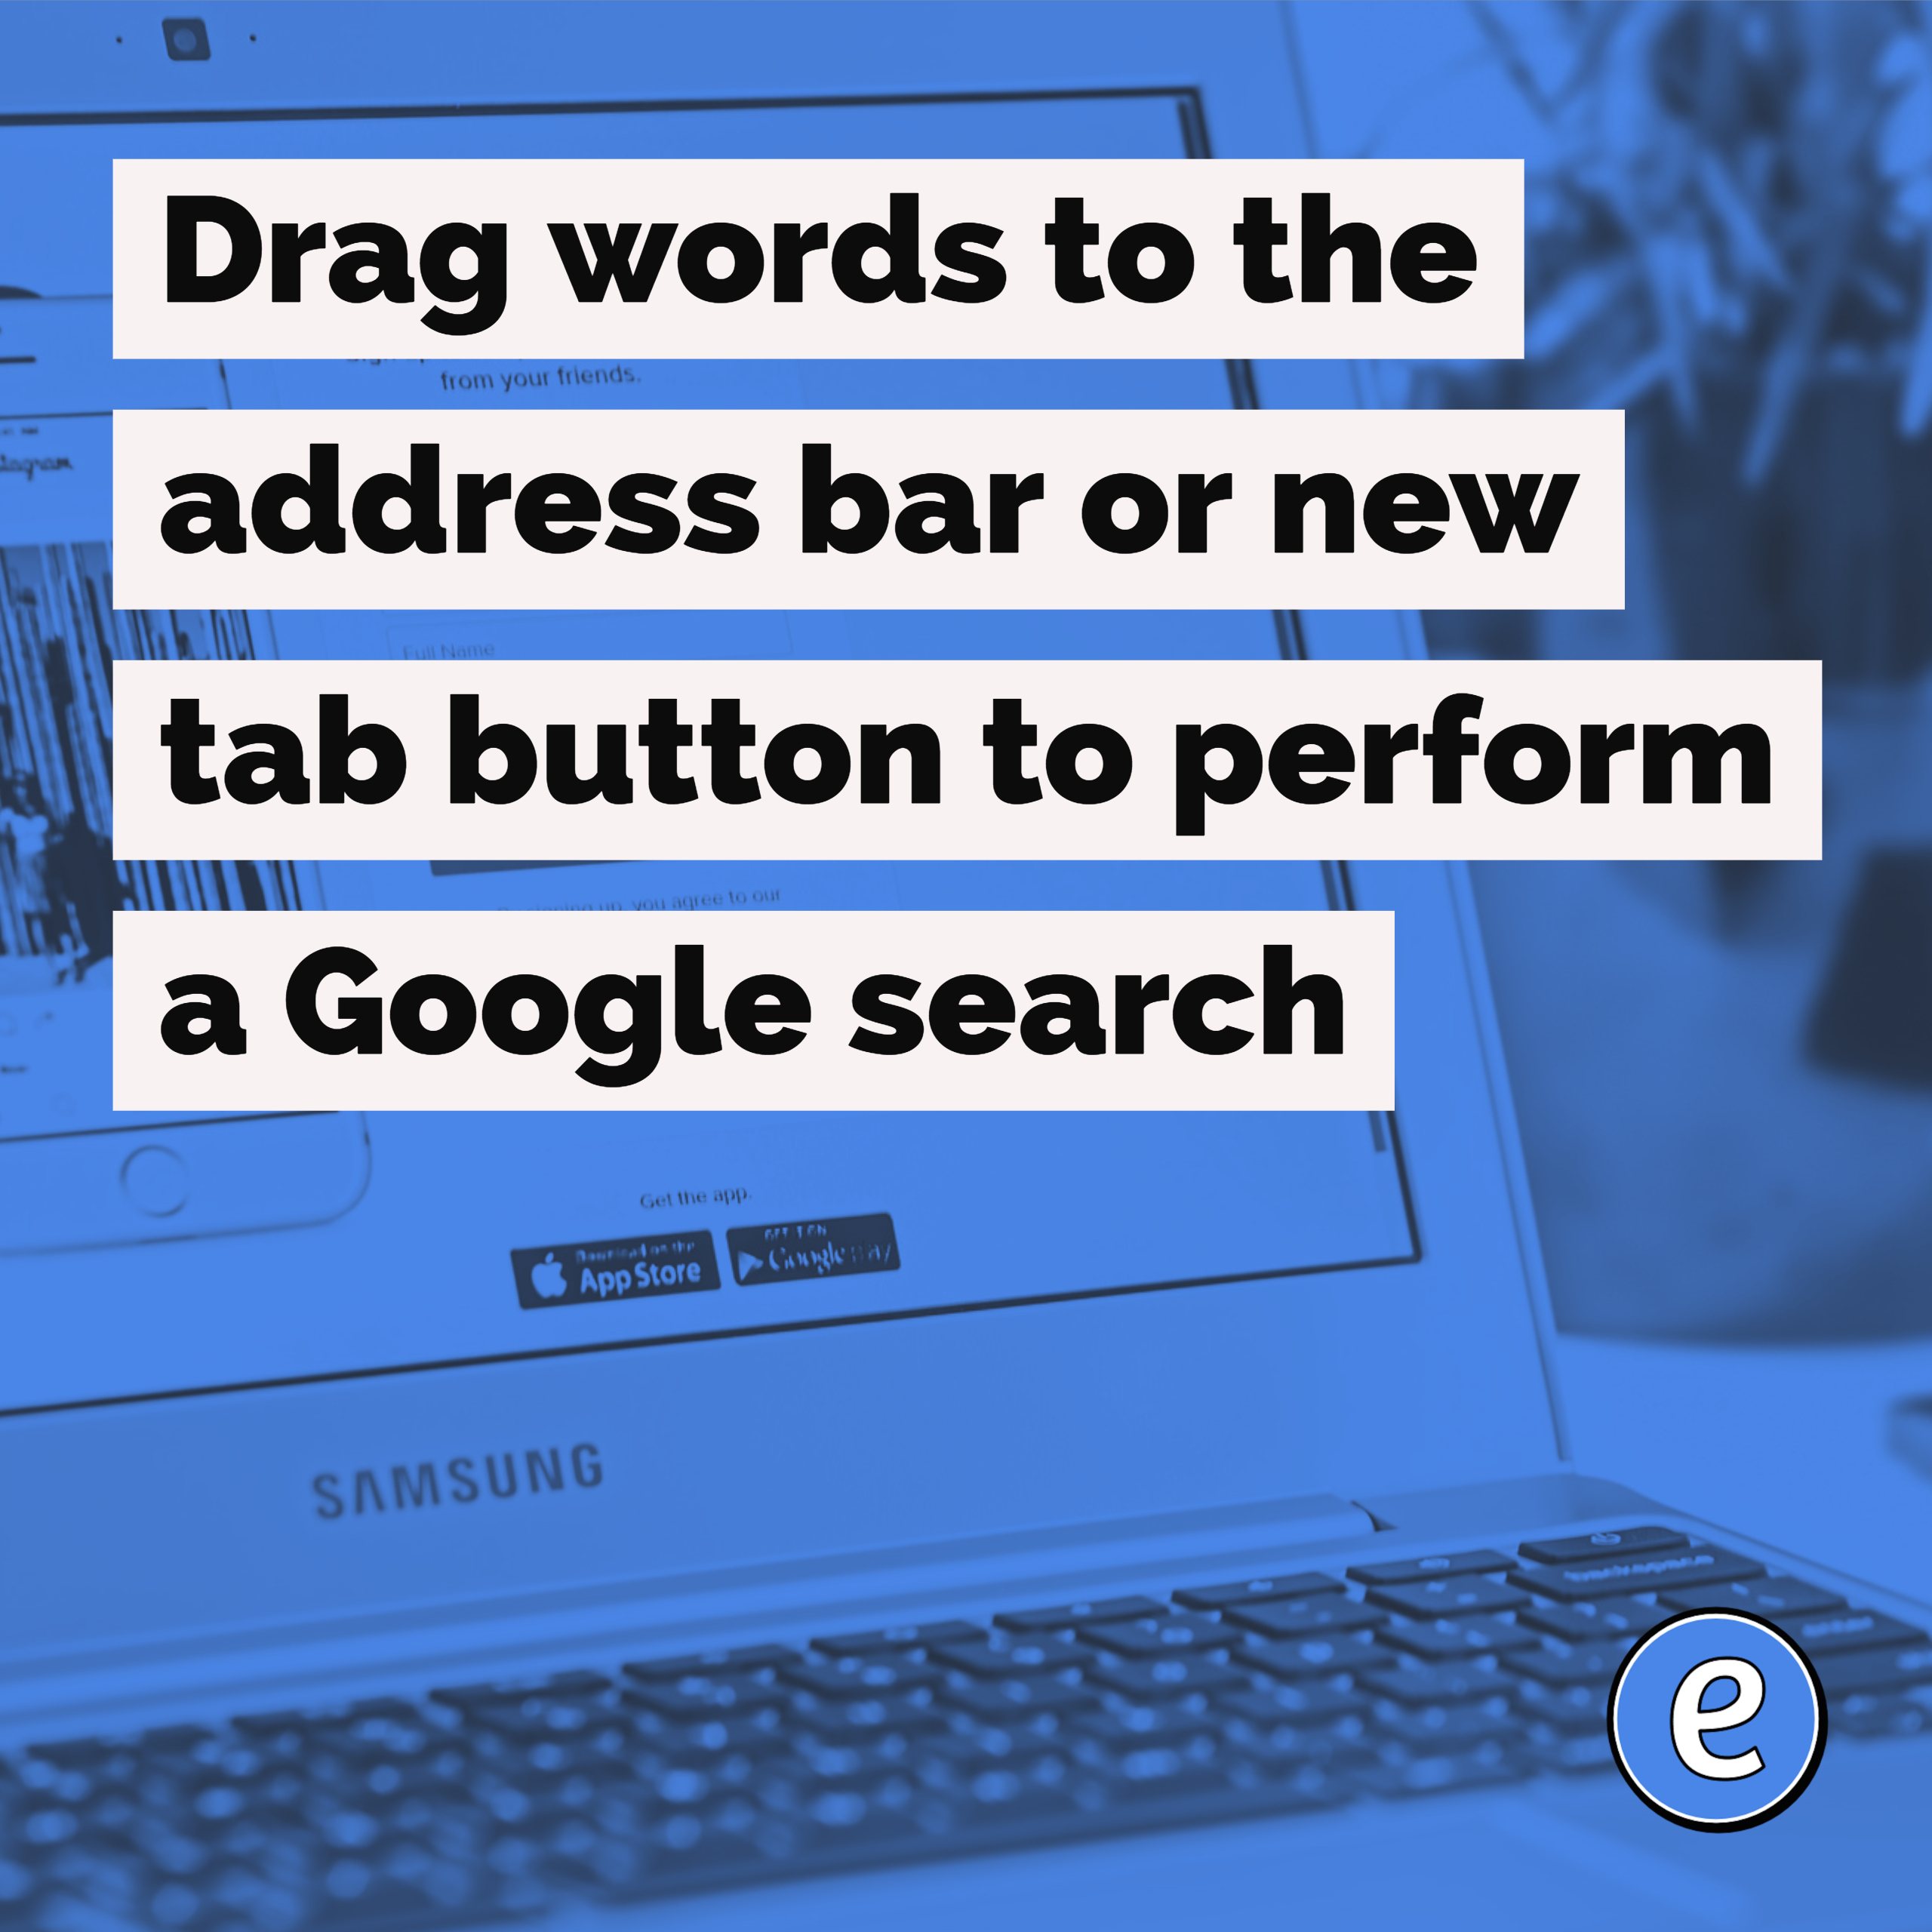
Now here’s something I just learned. After highlighting words on a web page, you can drag the highlighted words to the tab bar and Chrome will perform a Google search. The same thing happens when you drag the highlighted words to the url bar. This requires a little more effort than right-clicking on the highlighted…
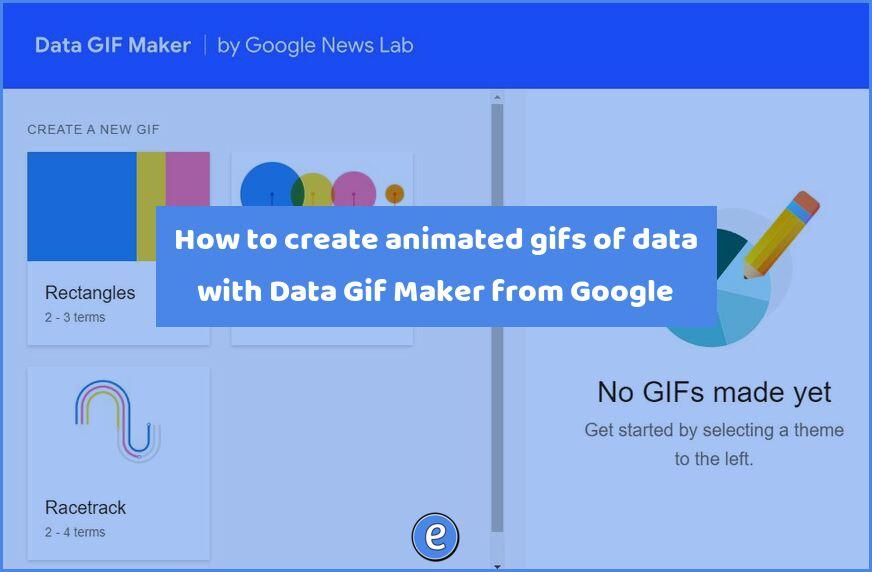
Source: Data Gif Maker Wow, I can’t believe I’ve never heard of Data Gif Maker before! The Google site is a great way to create animated gifs that you can use in projects such as Google Slides. It took me all of a minute to create this gif: Once you create your gif, you can…
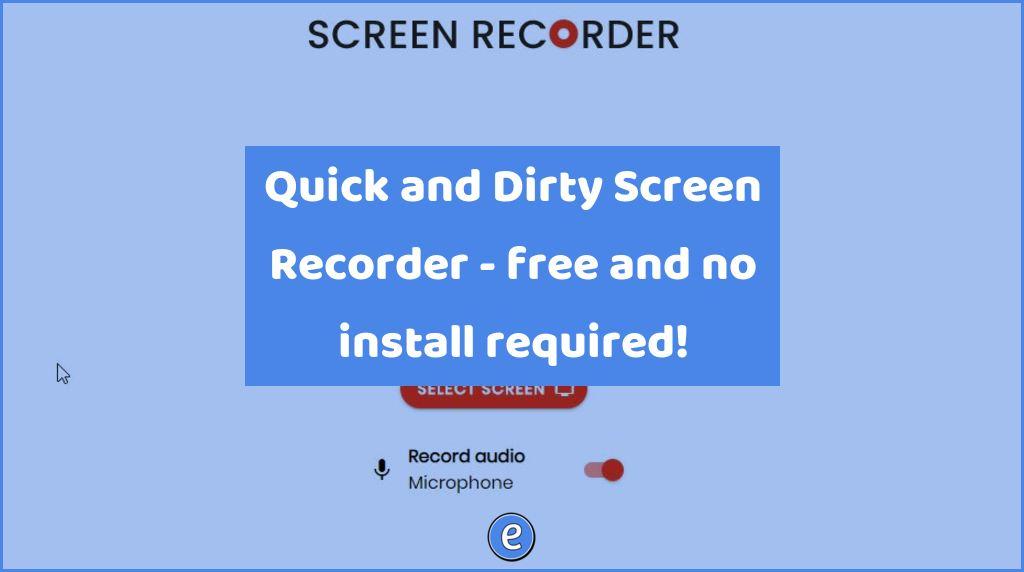
Source: Screen Recorder | Free, Private, No Ads Screen Recorder creates a screencast, with or without a microphone. That’s it. No editing, no webcam, no nothing. When the recording is complete, you can download a movie file in .webm format. Sure, if you have access to Screencastify (free during the current crisis) Loom (free for…

G Suite’s journey began 15 years ago with the introduction of Gmail in 2004. Back then, Gmail pioneered a new and secure approach to email with 1GB of free storage and lightning-fast Google search built right in. Gmail continues to help people manage their work and personal lives with the help of useful innovations—from priority…
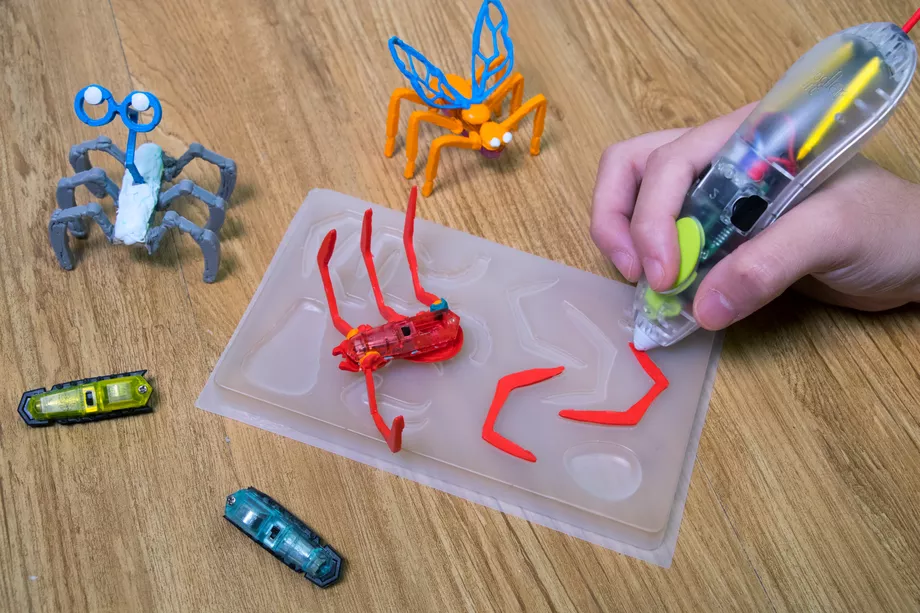
3Doodler has also partnered with robotic insect toy company Hexbugs to launch a “Make Your Own Hexbug” set, which lets kids draw insect body parts and legs on a custom DoodleMold. The little motor inside the completed Hexbug lets the robotic insects hop and scurry across, which kids can put inside mazes or race against…