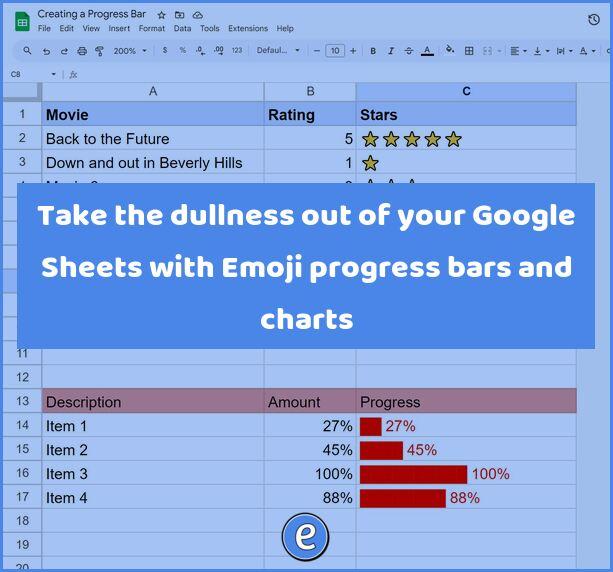
Take the dullness out of your Google Sheets with Emoji progress bars and charts
You can use dry numbers in your Google Sheet, or even add a chart, but there is an easy way to make dynamic progress bars and charts in Google Sheets using Emojis and the REPT function.
What you will be creating
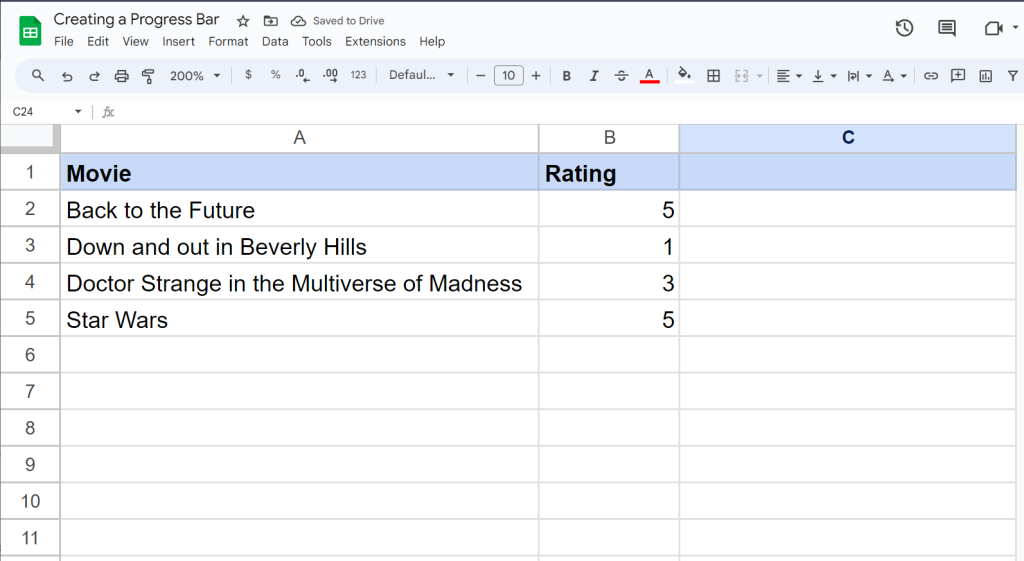
We’re going to be taking this sheet:
and making it a little more interesting:
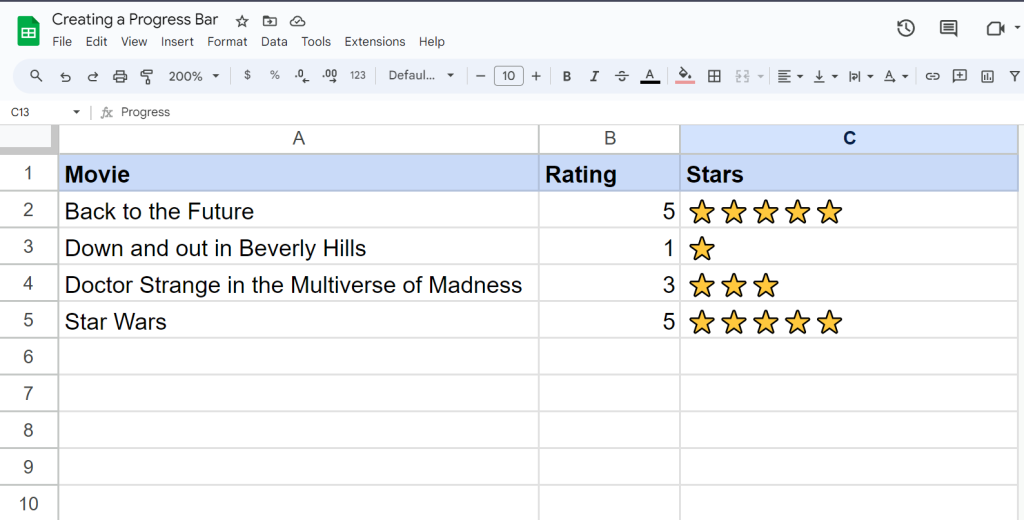
To create our more interesting sheet, we’ll be using the REPT function.
Finding our character
First off, we need to find a character to use for our chart. We can use any emoji character we want, or for a boring bar chart we can use the unicode character numbered 9608 with the CHAR function.
One caveat to using the REPT function, we can’t graph fractional characters. This works well for whole numbers though. Our first example is going to be to graph out our star ratings for movies.
Our first column is the name of the movie, and the second column is our number rating. The third is where we are going to draw a star for each level of our rating. This will use the REPT function:
=rept("⭐",B2)The REPT function takes two parameters. The first parameter is the text to repeat, in our example it’s a single star. The second parameter is for how many of the characters to print. This will use whatever is in the cell for B2. Once we enter that formula, it will be replaced with the stars.
Now, if we want a progress chart based on percentages, we will add some math to our function. In this example, we will take the percentage number and multiple it by 10. We’re also going to use the CHAR function so we can use a block character:
=rept(char(9608),b14*10)&" "&text(b14,"#0%")Wait a second, what’s up with these ampersands and the text function? Those are used to put the percentage number with the bar. You can omit the ampersand and everything following it if you don’t want the percentage with the bar. The TEXT function converts a number over to text while also applying a format for the number. In this case it’s showing the whole number, no decimal point, with a percentage sign at the end.
The charts automatically update as the numbers change, which is really cool. And you can use other characters, basically any emoji or unicode character. To see the characters, go to the Insert > Emoji menu or use your computers emoji selector. For Windows, hit the Windows key and then the period (.), under macOS it is command+control+space.
Try it out!
You can make a copy of my spreadsheet and play around with the numbers or copy the formulas for your own use!